MMR analysis follows. Standard charting begins on second page.
When looking at MMR & Active Players from the data on Mclama’s site, we can rarely detect much of a discrepancy. Due to the overmatch that occured in game 48, it seems clear there is a disparity and a possible solution.
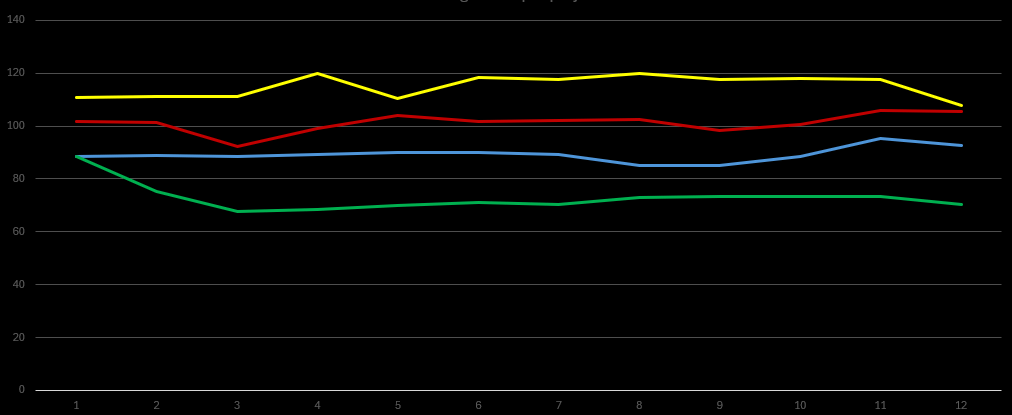
In the above chart, we have data points from hour 1 thru hour 12. To properly interpret this data, we should call each point a unique name. Actives is the number of active playerrs, Total MMR is the sum of all actives MMR used for balancing, and AvgMMR is Actives/TotalMMR.
Yellow starts with a high AvgMMR with Red slightly behind. The current fix is to add new players to Green and Blue. However, this brings Green’s AvgMMR lower and lower, while Blue remains unchanged and Yellow gains strength.
The correct solution for this seem to be, when adding players to teams, calculate the average player MMR. Send lowest (new players) to the highest AvgMMR team and add high MMR players to the lowest AvgMMR team.
This will allow the MMR curves to bend in the desired direction.
Standard Game Charting begins below
At the start of this game, Yellow was favored by many to win due to matchmaking and activity. Blue held second place for half the round, as Green began to claim territory. Around the 16 hour mark, Yellow took most of the nodes and VPs, setting up a 3v1 on a quick rounds game.
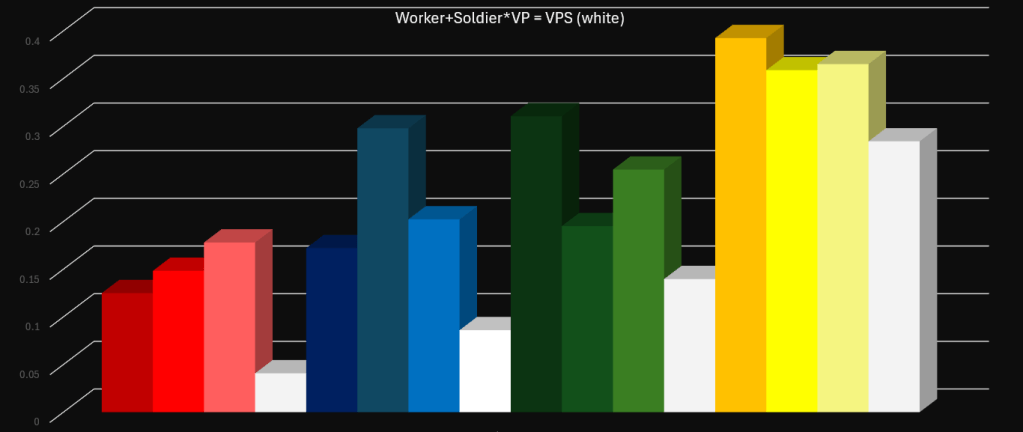
Yellow clearly outperformed all other teams. Green attempted to take some Yellow territory but was overrun on countermove. Red is holding a good position and may get 3rd. Blue has been quiet after the start of the round.
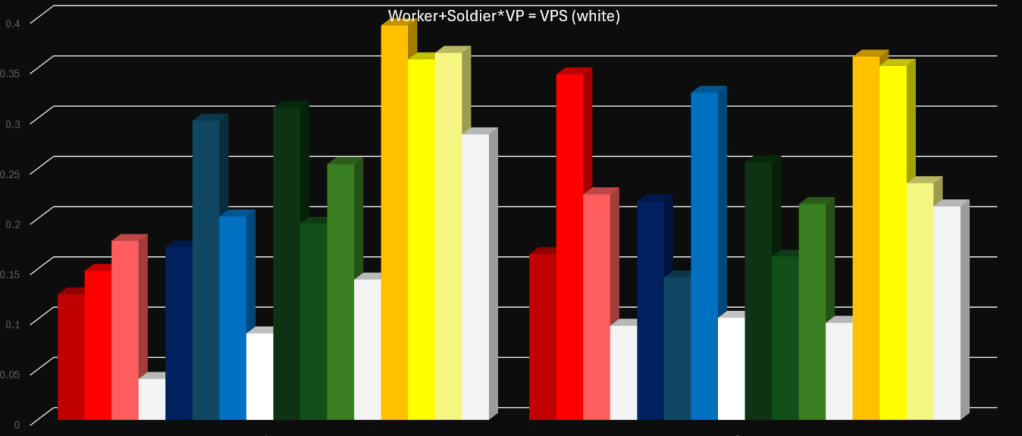
Heading into 48 hours, Round 2 draws to the 20 hour mark and 12 hours away from close. Teams are focused on putting Yellow in last after their dominance in Round 1, but their soldier and worker production still outpace all other factions. Red has picked up in production as Blue and Green remain conjoined.

Leave a comment